Graph model
A GenotypePhenotypeGraph is a NetworkX DiGraph over the genotypes of a gpmap-v2 GenotypePhenotypeMap. Each node carries the row attributes from gpm.data; each edge connects neighbors under a chosen distance metric. Fixation-model probabilities are stored as the edge attribute prob.
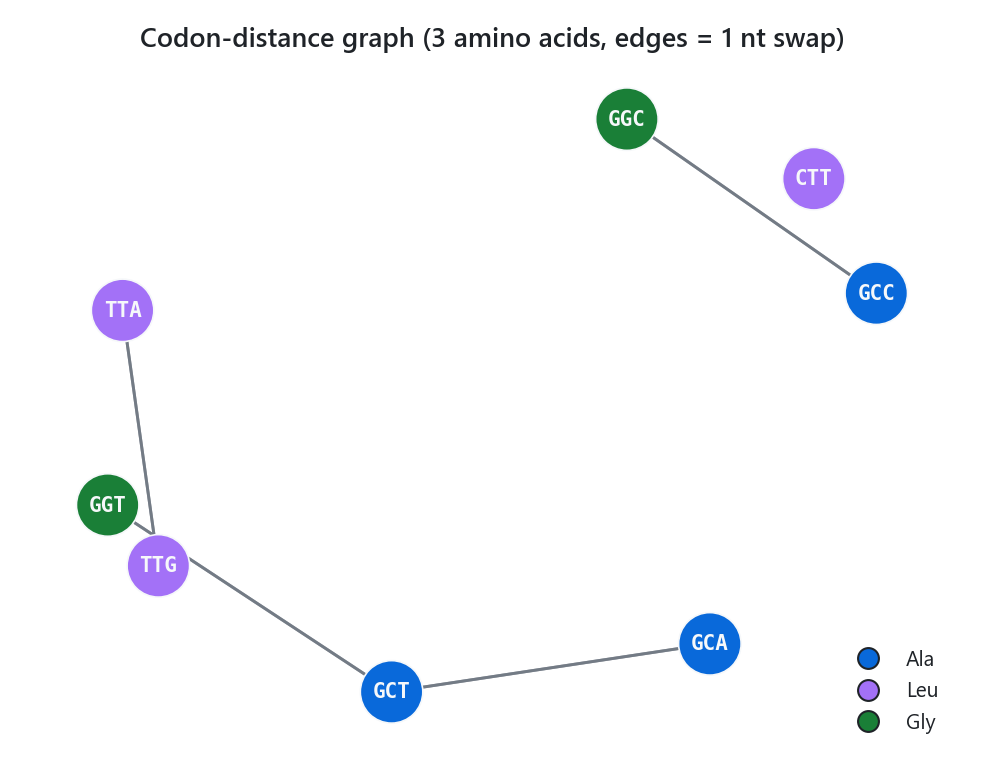
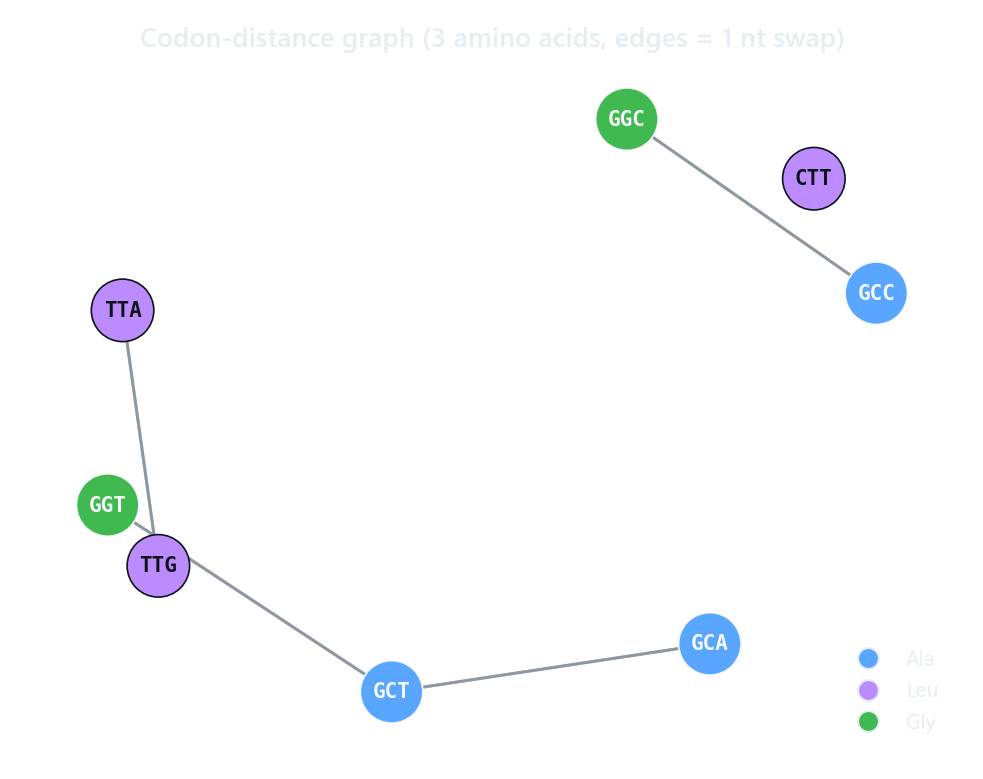
The distance metric decides which nodes are neighbors. Under codon distance, edges connect codons one nucleotide apart, so the graph reflects the genetic code rather than amino-acid Hamming steps.
Construction flow
from gpmap import GenotypePhenotypeMap
from gpgraph import GenotypePhenotypeGraph

gpm = GenotypePhenotypeMap(
    wildtype="AAA",
    genotypes=["AAA", "AAT", "ATA", "TAA", "ATT", "TAT", "TTA", "TTT"],
    phenotypes=[0.1, 0.2, 0.2, 0.6, 0.4, 0.6, 1.0, 1.1],
)

G = GenotypePhenotypeGraph.from_gpm(gpm, neighbor_function="hamming", cutoff=1)
from_gpm does three things:
- Stash the map.
G.gpmreturns the attachedGenotypePhenotypeMap. Used by layout helpers, fixation models, and path helpers. - Populate nodes. One node per row in
gpm.data. The node id is the row index. Every column ingpm.databecomes a node attribute (genotypes,phenotypes,stdeviations,n_replicates,binary,n_mutations). - Populate edges. Calls
gpgraph.neighbors.get_neighbors(...)to find neighboring genotype pairs and adds them as bidirectional edges. Each undirected pair(i, j)becomes two directed edges,(i, j)and(j, i).
Node attributes
Every node carries the columns of gpm.data as attributes:
| Attribute | Source | Notes |
|---|---|---|
genotypes |
gpm.genotypes[i] |
string sequence |
phenotypes |
gpm.phenotypes[i] |
float64 |
stdeviations |
gpm.stdeviations[i] |
float64 (NaN by default) |
n_replicates |
gpm.n_replicates[i] |
Int64 (1 by default) |
binary |
gpm.binary[i] |
binary string |
n_mutations |
gpm.n_mutations[i] |
Int64 |
Add your own attributes by mutating the graph after construction:
Edge contract
After from_gpm, every edge has no attributes. After G.add_model(column=..., model=...), every edge has a prob attribute holding the fixation probability (or model output) for that edge.
The path helpers in gpgraph.paths rely on the prob attribute, so calling them before add_model raises ValueError.
add_model
add_model picks up node fitnesses from a column in gpm.data, then evaluates a fixation model edge by edge. The evaluation is vectorized: every edge's source and target fitness are looked up in NumPy arrays, the model is called once on the full arrays, and results are written back into the edge attribute dict.
Edge cases:
column=Noneassigns every node fitness 1.0, so every edge getsprobequal to the model's value atf=(1.0, 1.0).model=Noneassigns every edgeprob = 1.0(the constant-one default).modelas a string looks up the model in thegpgraph.fixation.MODEL_REGISTRY.modelas a callable is called asmodel(fi, fj, **model_params). If the callable does not vectorize (raisesTypeErroron arrays),add_modelfalls back to a Python loop.
**model_params are stored on the graph and forwarded to the model on every call. The most common parameter is population_size for moran and mcclandish.
I/O
The graph can be reconstructed from a gpmap-v2 JSON or CSV save:
These delegate to gpmap.read_json / gpmap.read_csv to load the map, then call from_gpm with default neighbor settings.
For graph-level serialization (with prob attributes intact), use NetworkX's own writers: nx.write_gml(G, "graph.gml"), nx.write_gpickle(G, "graph.gpickle"), etc.
Migration from v1
gpgraph-v2 is not wire-compatible with harmslab/gpgraph. The deltas that matter:
| v1 | v2 |
|---|---|
GenotypePhenotypeGraph(gpm) (constructor takes the map) |
GenotypePhenotypeGraph.from_gpm(gpm) |
Node attribute fitnesses |
Node attribute phenotypes (matches gpmap-v2) |
__repr__ side-effected a matplotlib figure |
__repr__ is silent |
| Matplotlib was a hard dependency | Matplotlib is an optional extra (gpgraph-v2[plot]) |
gpgraph.neighbor_functions module |
gpgraph.neighbors module |
Pairwise get_neighbors returned list[tuple] |
Returns np.ndarray[int64] of shape (E, 2) |
| Python >= 3.7 | Python >= 3.11 |
The distribution name on PyPI is now gpgraph-v2. The import path is still gpgraph.