Forward paths and flux
Once G.add_model(column=..., model=...) has populated the prob edge attribute, you can ask trajectory questions: which paths from WT to a target genotype carry the most probability mass, and which edges does that mass flow through?
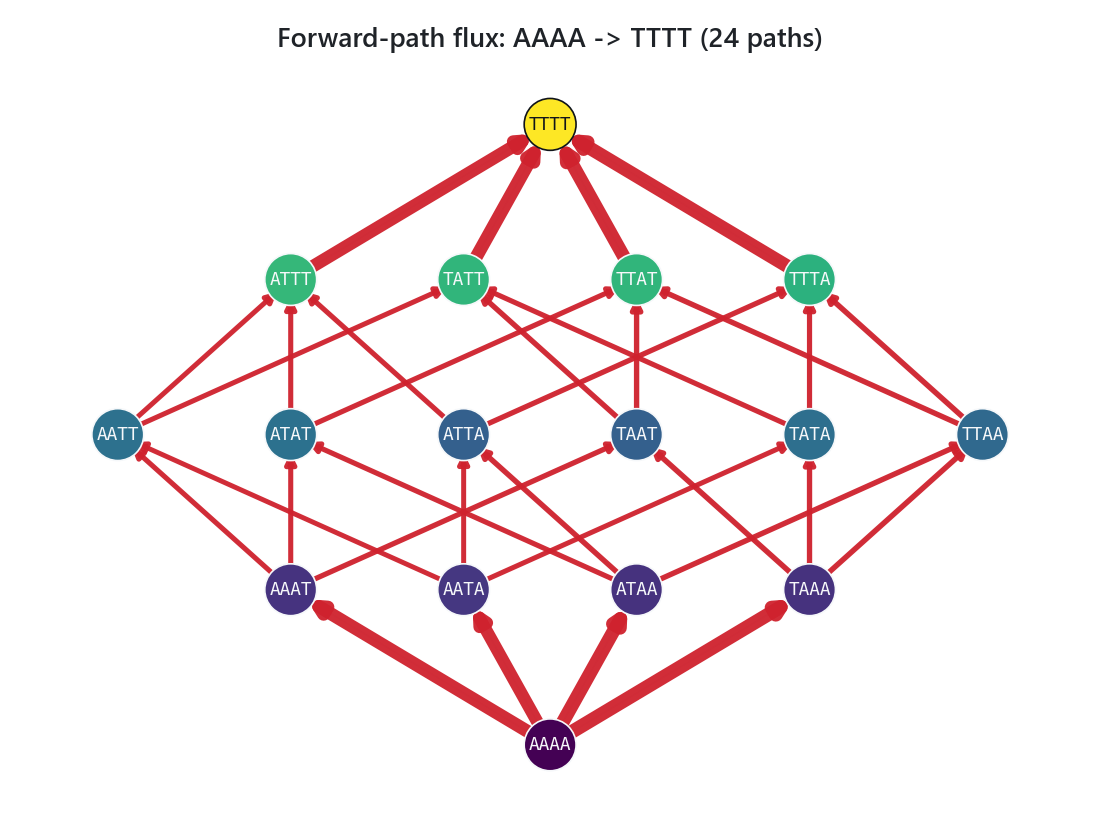
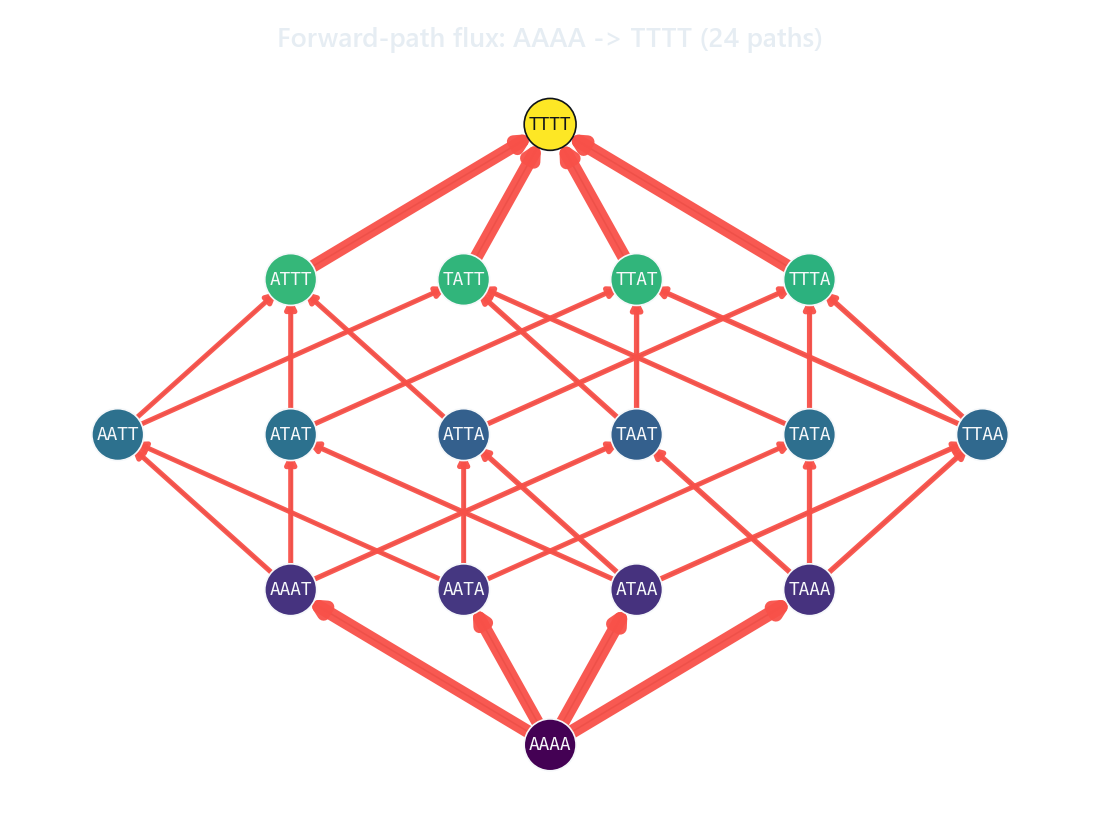
Reducing the enumerated paths to per-edge flux highlights the backbone of the adaptive trajectory: the thickest edges are the ones most evolutionary paths from wildtype to target pass through.
Enumerate paths
forward_paths returns all shortest paths from source to target as a list of node-index lists:
Endpoints accept three forms:
- Node index (int):
forward_paths(G, source=0, target=7) - Genotype string:
forward_paths(G, source="AAA", target="TTT") - Binary string from
gpm.binary:forward_paths(G, source="000", target="111")
For an L-mutation orthotope (full biallelic with WT at one corner, target at the opposite), there are L! shortest paths. Pass max_paths=N to cap the enumeration:
Multiply edge probabilities along each path
from gpgraph.paths import forward_paths_prob

paths_prob = forward_paths_prob(G, source="AAA", target="TTT")
# {(0, 1, 4, 7): 0.0017, (0, 1, 5, 7): 0.0021, ...}
forward_paths_prob returns a dict keyed by path tuples (so you can hash them) mapping to the product of edge probs along that path.
Calling forward_paths_prob before add_model raises ValueError("edge ... has no 'prob' attribute; call add_model first").
Reduce paths to per-edge flux
from gpgraph.paths import paths_prob_to_edges_flux

flux = paths_prob_to_edges_flux(paths_prob)
# {(0, 1): 0.0038, (1, 4): 0.0017, (1, 5): 0.0021, ...}
Edge flux is the sum of path probabilities passing through that edge. It is what you want for edge-width visualization or for ranking the most-traveled steps.
Other utilities
Unique edges across paths
from gpgraph.paths import paths_to_edges

edges = paths_to_edges(paths, repeat=False)
# [(0, 1), (0, 2), ..., (4, 7), (5, 7)]
With repeat=True, each edge is listed once per path that uses it (good for counting):
Edge visit counts
from gpgraph.paths import paths_to_edges
from collections import Counter

counts = Counter(paths_to_edges(paths, repeat=True))
Per-node flux from edge capacities
from gpgraph.paths import edges_flux_to_node_flux

# After assigning a 'capacity' edge attribute (e.g., from external flow data):
node_flux = edges_flux_to_node_flux(G)
# {0: 0.0, 1: 0.0038, 2: ..., ...}
edges_flux_to_node_flux reads the edge capacity attribute (not prob) and sums incoming capacities per node. Use this when you want the in-flux at each node from a precomputed capacity field.
Worked example
from gpmap import GenotypePhenotypeMap
from gpgraph import GenotypePhenotypeGraph
from gpgraph.paths import forward_paths_prob, paths_prob_to_edges_flux

gpm = GenotypePhenotypeMap(
    wildtype="AAAA",
    genotypes=["AAAA", "AAAT", "AATA", "ATAA", "TAAA",
               "AATT", "ATAT", "TAAT", "ATTA", "TATA", "TTAA",
               "ATTT", "TATT", "TTAT", "TTTA", "TTTT"],
    phenotypes=[0.1, 0.2, 0.15, 0.25, 0.3,
                0.4, 0.5, 0.55, 0.45, 0.6, 0.7,
                0.8, 0.85, 0.9, 0.95, 1.0],
)

G = GenotypePhenotypeGraph.from_gpm(gpm)
G.add_model(column="phenotypes", model="sswm")

paths_prob = forward_paths_prob(G, source="AAAA", target="TTTT")
flux = paths_prob_to_edges_flux(paths_prob)

# Top three most-traveled edges
import heapq
top = heapq.nlargest(3, flux.items(), key=lambda kv: kv[1])
for (src, dst), p in top:
    print(f"{gpm.genotypes[src]} -> {gpm.genotypes[dst]}: {p:.4f}")
The for_paths_prob output is suitable for direct visualization via gpgraph.pyplot.draw_paths (see Plotting).